


 (ES)")
")
Our Blog - Subject 1 |
(1) Sectoral indicators vs. our company |
 |
Blog Index | ||
|
Are Staff Costs of my company in line with the sector it belongs to? And what about profits? Do we have too much Stock? ...
The first step in our Business Analysis is to analyze how we are in relation to our sector existing data. It's not easy to know exact details of our direct competence, but there are institutions that collect general information and offer it grouped by sector and net turnover intervals in economic and financial ratios format.
Below we see an example of sectoral comparative, and we explain how to understand and interpret the data, and then we show how we can access to the sectoral data we are interested in. |

|
|
An example of sectoral comparative |
|
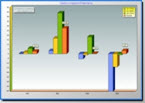
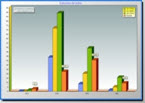
The following shows an example where several ratios for different companies have been obtained (consolidated format) and they are compared with existing values for the sector and net turnover interval these companies belong to.
|
 |
 |
 |
 |
 |
 |
|||||
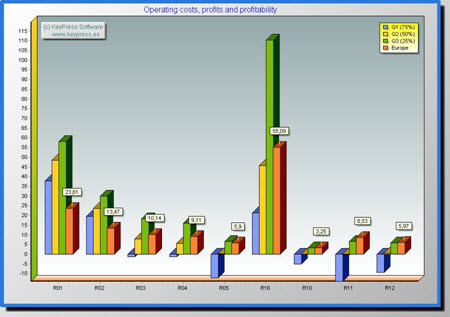
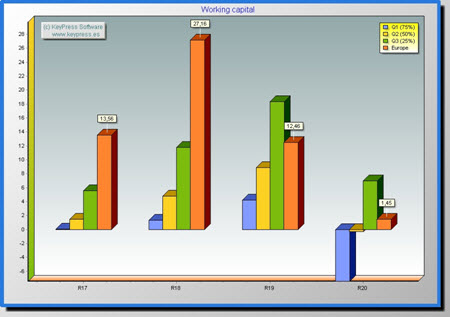
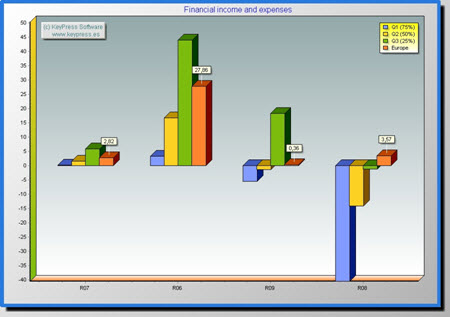
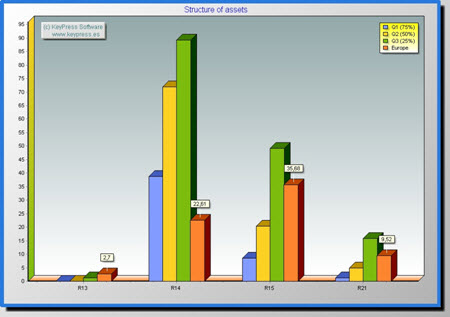
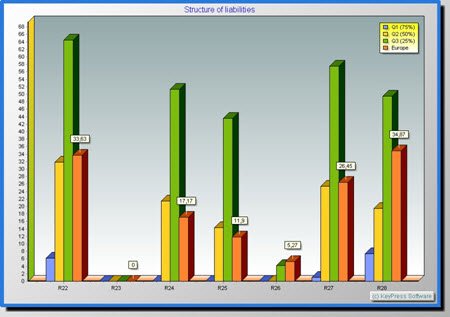
| All | Operating costs, ... | Working capital | Financial results | Structure of assets | Structure of liabilities |
|
In our example we work with ratios provided by the CBSO Bank of Spain, if the company is located in a different country it is advisable to find sectoral information for that country.
A ratio represents the relation between two values and, therefore, we have to interpret the result considering the values it comes from: it is not comparable a 10% profit over net turnover between two companies whose net turnover is 100 million and 1 million respectively.
The ratios studied in the example are obtained from different areas of Financial Statements (Balance Sheet and P & L), and sectoral reference values are calculated from data supplied by companies in all sectors, and are shown as quartiles statistical distribution:
|
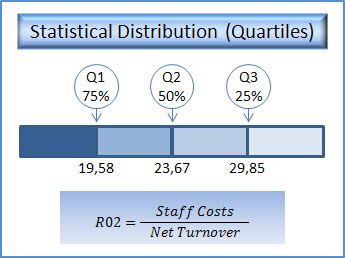 |
Quartiles distribution means that for each ratio a sorted list with sample companies according to their value for that ratio is created; they are divided into four intervals and determined the cutoff values (quartiles):
In the left image we have developed R02 ratio for our example. Looking at its value for consolidation column (Europe), this is [13.47], which means that we are in the first interval, ie, 75% of companies have staff costs higher than ours (relative to net turnover), which, initially, would point to a good management in this sense. |
|
However, we must analyze many more aspects of our business to reach that conclusion: is also profit ratio the expected one? Could have a positive impact on our profitability ratio the increasing of staff costs? How is it about the budget? ...
The optimum position within distribution interval (to left or right) depends on the ratio; for example R05 (Economic net result / Net turnover) should be placed as close to the right as possible.
|
How to access to sectoral indicators? |
|
|
|
|
|
If you are a member of Linkedin you can share this article using the attached button. |
|
Go to top |
|
|
Comments area |
|
|
|
|
|
 |
 |
 |
 |
 |
 |